


Breaking News: Bitcoin and Altcoins Face Critical Resistance Levels Amid Market Analysis | 2025

Bitcoin and Altcoins Price Analysis: March 5 Update
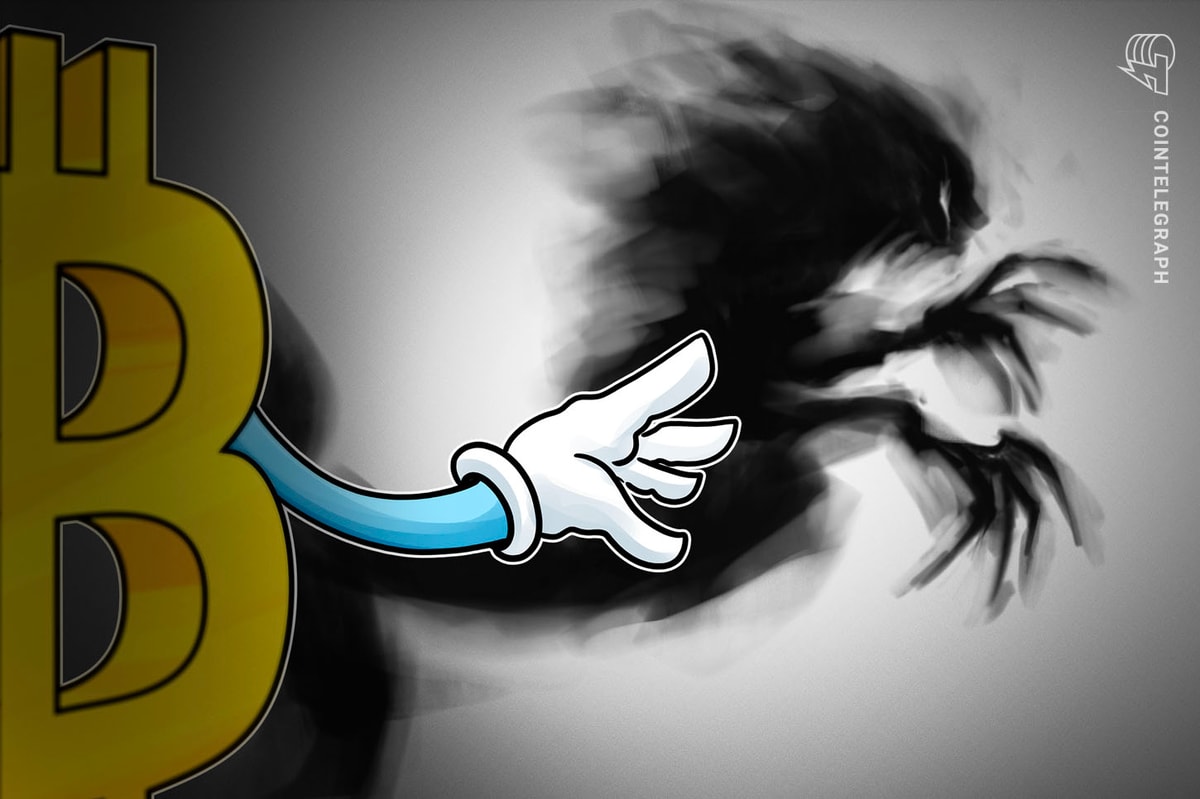
Bitcoin is currently facing challenges in surpassing the $90,000 mark as bearish forces attempt to maintain this level as a resistance point. However, both Bitcoin and altcoin charts indicate that an upward trajectory is the most probable outcome for prices in the near future. On March 4, Bitcoin turned upward from $81,500, with bulls striving to extend this recovery above the $90,000 threshold on March 5.
Resistance Levels and Market Sentiment
Despite the optimistic outlook, some analysts have expressed caution regarding Bitcoin’s immediate future. According to a report from Bitfinex analysts dated March 3, Bitcoin may encounter “significant resistance” at the $94,000 level. Additionally, CryptoQuant contributor XBTManager noted in a Quicktake post that Bitcoin is likely to remain in a consolidation phase for the foreseeable future. The analyst emphasized that the optimal buying opportunity will arise when short-term holders—those who have held Bitcoin for less than 155 days—begin to sell, while long-term holders start accumulating.
Long-Term Prospects for Bitcoin
While the short-term price action remains uncertain, investor confidence in Bitcoin’s long-term potential remains strong. Mexican billionaire Ricardo Salinas revealed in a Bloomberg interview that 70% of his investment portfolio is allocated to Bitcoin, with the remaining 30% consisting of gold and gold mining stocks.
Technical Analysis: BTC/USDT Pair
The BTC/USDT pair has reached the 20-day exponential moving average (EMA) at $91,174, a crucial resistance level to monitor. A breakout above this EMA would indicate a reduction in selling pressure, allowing the pair to aim for the resistance line of the triangle formation and potentially reach the 50-day simple moving average (SMA) at $97,259. A successful break and close above the 50-day SMA would signal a resurgence of bullish momentum.
However, this optimistic scenario could be undermined if the price sharply declines from the 20-day EMA and breaks below the triangle formation. Such a move could lead to a retest of the February 28 intraday low of $78,258.
Ethereum and Other Altcoins
Ethereum (ETH) is also facing significant resistance levels. The relief rally is expected to encounter strong resistance at the 20-day EMA, currently at $2,467, followed by the downtrend line. If the price retraces from this overhead resistance, bears will attempt to push the ETH/USDT pair below $2,111. A successful breach could result in a decline to $1,750. Conversely, a close above the downtrend line would indicate that bears are losing control, potentially leading to a rally towards $3,400.
XRP and Market Dynamics
For XRP, the price action is also critical. If the price holds above the 20-day EMA at $2.47, bulls will aim to push the XRP/USDT pair towards the resistance line. A break and close above the channel would open the door for a rally to $3.40. However, if the price declines from the 20-day EMA and falls below $2.53, it would suggest that bears are gaining the upper hand, potentially leading to a drop to $1.99 and even $1.27.
Conclusion
As the market continues to evolve, the bulls are striving to initiate a recovery. However, they are likely to face selling pressure at the 20-day EMA for various altcoins. Investors should remain vigilant and monitor these critical resistance levels as they navigate the current market landscape.